Step 1 · The symptom
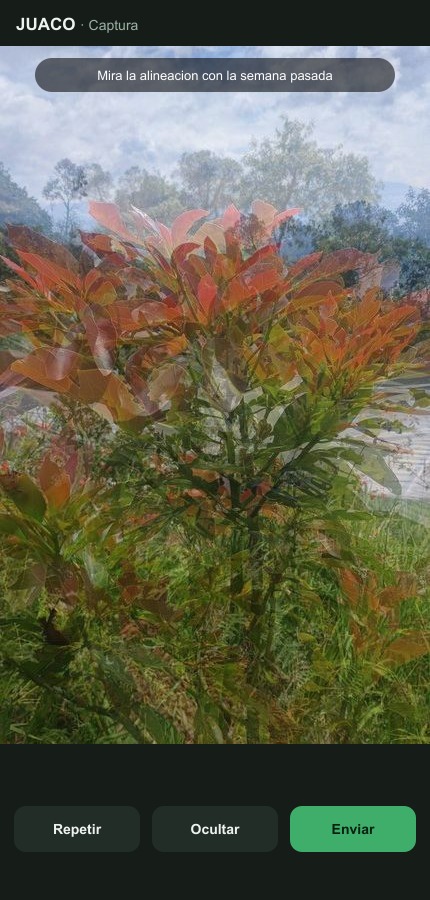
How is the crop doing this week?
A photoVigor, growth stage, plant health and soil.
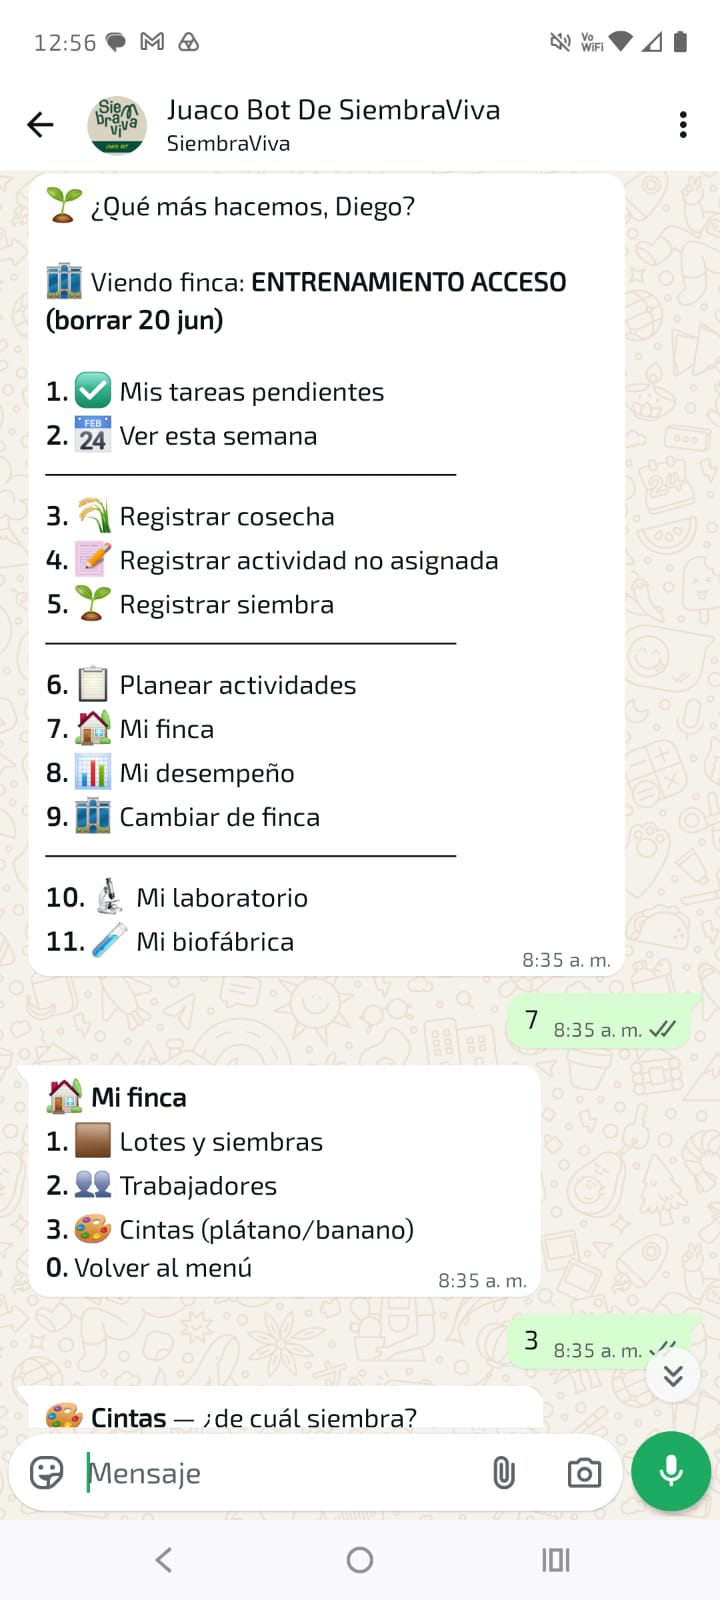
A voice noteEverything done on the farm, on record.
Every week, no travel neededThe grower sends it on WhatsApp.
Field records
What you get · a dashboard for every farm
Three indices. Three questions.


Swipe to see all three →
Plantain · Urabá. One farm, live (Oct 13, 2026). Mid-season indicators, not a yield forecast.
What you get · full field records for every farm
What’s on the farm, what’s been done — and what’s coming.


Kilos are shown only where the forecast has already proven accurate. Back-tested on this farm’s previous three months, it was off by −13%, −21% and −13% against actual harvest. Where it isn’t accurate yet, it shows the beds coming in, without kilos.
Vegetables · Antioquia, Colombia. Live dashboard, October 13, 2026. The forecast is built from recorded plantings and harvests, so it needs some farm history.
What you get · an audit view for every farm
The full history, with the trend.
Sap, date by dateNew leaf versus mature leaf, by field.
Soil and soil biologyFungi, bacteria, protozoa and nematodes.
Inputs and field workEvery task, with its evidence photo.
From the index to the dataThe data behind every number, one tap away.


Coffee · Nicaragua. Live audit view, October 13, 2026: 67 lab samples and 2,413 recorded tasks since March 2024.
For your agronomist · the multiplier
The network view shows them whom to call.
All their farmsEach with its three indices and the date of the data.
A farm with no score shows what still needs measuringThat’s this week’s call list.
One tap on any farmFrom the network view to the task, and from the task to its photo.
Plantain · Urabá, Colombia. 121 farms, live network view, October 13, 2026; names blurred. Tasks and photo are from one of these farms.


